# Fractional Canopy Cover
Forests play an essential role in our ecosystem and getting a quantitative measurement on the forest cover is essential for various applications. From understanding ecosystem health, biomass estimation, and monitoring changes over time due to factors like climate change or land use. Higher canopy covers regard for dense forests or other complex ecosystems while lower canopy cover means the presence of grasslands and less sparse vegetation. Getting a percentage of forest cover is also useful in controlling soil erosion to carbon sequestration which serves as an important factor in understanding and mitigating climate change.
Given all these uses, having an accurate percentage of the forest cover is imperial in different studies. The objective of this use case was to derive the fractional canopy cover (FCC) using Sentinel-1 and Sentinel-2 in a random forest regression approach from very high-resolution (VHR) data acquired from the Planet Scope satellite constellation. This was done for an area with different forest types spreading throughout central Europe around the Alps as defined by the Eusropean Strategy for Alpine Regions (EUSALP).
# Data Preparation
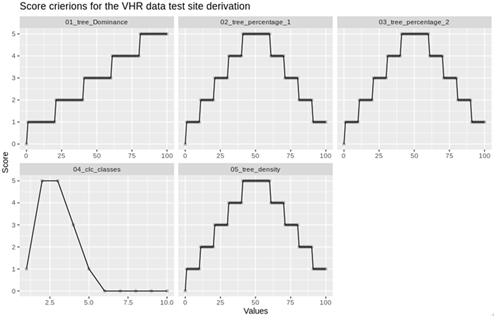
As VHR commercial data from Planet was used for the training of the model, a stratification scheme was devised for getting the maximum coverage throughout the study area. Additional data which included Copernicus Forest High-Resolution Layers (HRL, https://land.copernicus.eu/pan-european/high-resolution-layers/forests) of “Forest Type” and “Forest Cover Density” as well as the CORINE Land Cover were used to find suitable subsets within the study area to derive the target variable from the VHR data. The study area was divided into 40,000 potential test sites, which were sub-sequentially analyzed based on the amount of forest, its density, tree dominance as well as the land cover classes. Therefore, five different score criteria were introduced for each potential test site. These are shown below in Figure 1.
Based on the maximum scores within each cell Planet data was ordered for the 300 highest-scoring areas and then using these tiles, forest masks were created. 3 masks were generated from this VHR dataset including evergreen, deciduous, and mixed forests based on various thresholds of NDVI values. Finally, these masks were summed together and then resampled to 60 meters to be compatible with Sentinel 1 and 2.
# Model training
The Forest masks extracted from the VHR data were vectorized to polygons which were then used as training points for the random forest regression model. The model's predictors are the Sentinel-2 Bands 02, 03, 04 and 08 representing Blue/Green/Red/NIR and the Sigma0 Sentinel-1 VV and VH polarizations.
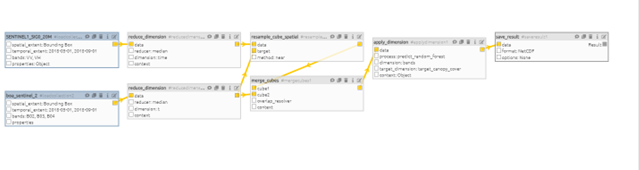
The trained model can be stored for further jobs in different regions within the interest area. In Figure 2 below a process graph is shown where the trained model is applied on the predictors mentioned above.
# Predicted Fractional Canopy Cover
In the fit_regr_random_forest process, the actual regression calculation is taking place. Based on the random forest implementation a model is created to predict the target variable. The fitting is done in a standard machine learning approach with 70% of the polygons whereas 30% of the polygons are used for the evaluation of the model.
# Validation
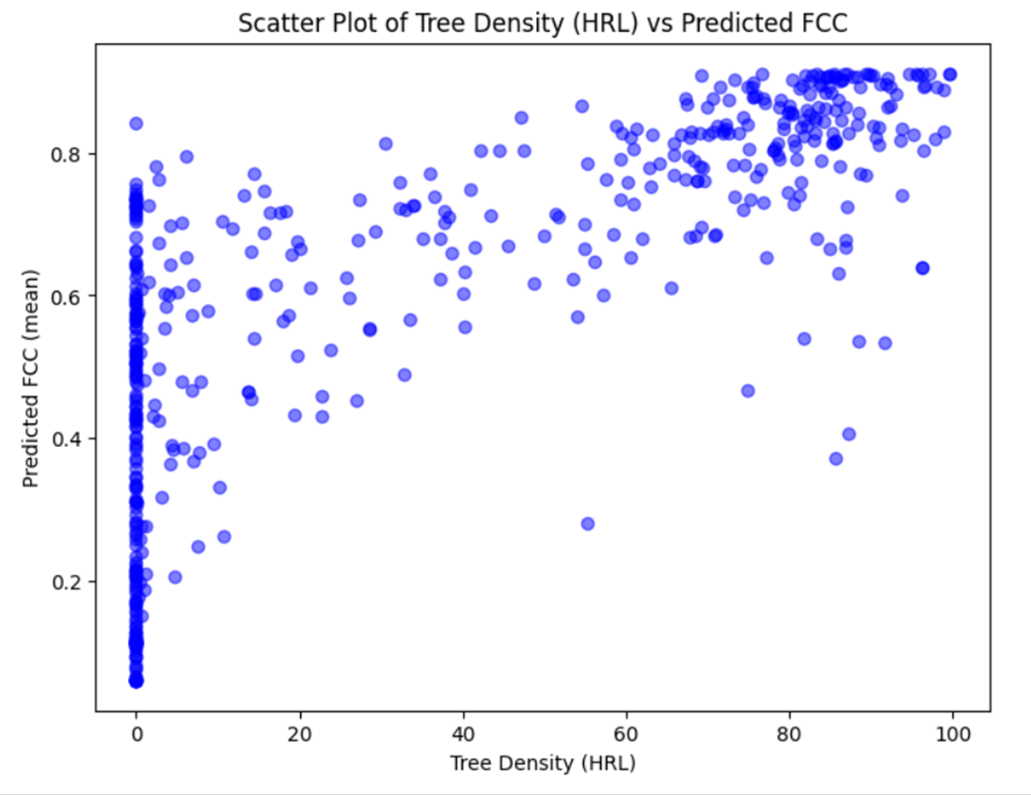
Polygons were separated in the initial stage of the project for the validation. 512 polygons with 36 pixels each corresponding to the HRL tree density layer were used for the validation task. The comparison showed a correlation of 0.76 summarised in the plot below in Figure 4.